Showing posts with label Indian Stock Market. Show all posts

Learn How To Start Investment in Stock Market?

HOW TO START?

1) In order to buy / sell a share, you need to first become a client of one of the stock market members who are commonly known as stock brokers.
2) Open Demat A/c
3) Open Trading A/c

MARKET MECHANISM

1) A stock market has many members who co ordinate for various activities in the process of placing orders, their execution and settlement etc. A person who desires to buy / sell shares in the stock market, can place his order through the broker either in the traditional manner or can place an online order himself through the terminal provided by the broker.

2) Two trading days are considered for settlement where Saturday, Sunday, Bank Holidays and trading holidays are not considered as working days for settlement. Hence, a trade done on Monday will get settled on Wednesday.

DO AND DON'TS

1) Always consult a professional. In order to avoid any mistakes in your investment decisions, you should always consult a professional to plan out your investments and to get qualified investment advice.

2) Keep yourself updated with latest market news If you are investing in equity, it is advised that you keep yourself updated about the latest market news as there are a lot of announcements that take place from day to day such as mergers, acquisition, dividends, Annual Meetings etc. This helps you to get a clue as to what is the effect of such news on your investments and what is the expected return from your investment.

3) Don't put blind faith in a stock tip from unofficial sources it is important to do some homework on the investment that you are planning to make. Don't just believe everything that is said about any stock tip from your friends or near n dear ones. If you come across any such tips, you should first verify it for its authenticity and then take your investment decision.

4) Don't put all your money in one sector or stock In equity investment, there are shares available for companies that cover almost every sector of the commercial sphere and thus provide you the opportunity to invest into a wide variety of sectors. Every sector or stock is affected by some or the other factors of the economy and as a result of it affect your investment in these stocks / sector.

About Author: MANSUKH investment & Trading services is an Online Trading Solution provider giving you ideas about latest stock market happenings, Online Share Trading, investment services, mutual funds and other offerings with advice to both fledgling investors and experienced day traders. For Best Stock Market updates visit their site http://moneysukh.com 


Always consult a stock market broker. In order to avoid any mistakes in your investment decisions, you should always consult a professional to plan out your investments and to get qualified investment advice.

Stock Market Tutorials for Beginners

WHAT IS STOCK MARKET?

Different business in India are having their expansion plans, all together they can't manage to have such big amount to use, so they are calling people to participate in their companies and get profit out of that in form of dividend, stock split, bonus share etc. Most stocks are traded on exchanges, which are places where buyers and sellers meet and decide on a price. Some exchanges are physical locations where transactions are carried out on a trading floor. The purpose of a stock market is to facilitate the exchange of securities between buyers and sellers, reducing the risks of investing.


WHY COMPANIES ISSUE STOCK?

1. When a company would like to grow, it issues stocks to raise funds and pay for ongoing business activities.
2. It is popular because:
I. The company does not have to repay the money
II. Paying dividends is optional
* Dividends are distributions of earnings paid to stockholders


STOCK MARKET BASICS

1. A stock is a tradable security that a firm issues to certify that the stockholder owns a share of the firm.
2. A share represents an investor's ownership in a "share" of the profits, losses, and assets of a company. It is created when a business carves itself into pieces and sells them to investors in exchange for cash.
3. In order to buy / sell a share, you need to first become a client of one of the stock market members who are commonly known as stock brokers.


STOCK EXCHANGE IN INDIA
1. The Bombay Stock Exchange (BSE)
2. National Stock Exchange of India Ltd (NSE)

FACTORS AFFECTING STOCK MARKET
1. Inflation
2. GDP
3. Global Markets
4. Govt policies
5. Market trends
6. Financial statements
7. News

FACTORS AFFECTING STOCK PRICE
1. Financial statement
2. Order book
3. Management
4. Land bank
5. Future plans
6. Growth
7. Commodity prices


About Author: MANSUKH investment & Trading services is an Online Trading Solution provider giving you ideas about latest stock market happenings, Online Share Trading, investment services, mutual funds and other offerings with advice to both fledgling investors and experienced day traders. For Best Online Commodity Services visit their site http://moneysukh.com

Weekly Market Outlook 25th June 2011

SNAPSHOT
Indian stocks markets finally succeeded in salvaging a close in the positive territory, snapping the two week downtrend, as the enthralling close to 700 points rally in the last two trading session of the week for the Sensex helped it to overturn the massive losses incurred on the initial day of the week. The benchmark indices went on to re-capture the important psychological 5,450 and 18,200 levels and end the week with close to two percent gains amid encouraging global cues including a resolution over Greece debt trouble after it gained EU and IMF's approval of its latest five-year austerity plan and also after a decision by International Energy Agency to increase oil supplies. However, what followed in the last two sessions was healthy short covering rally as it seemed like investors keenly awaited for a catalyst to buy in India since they were of the belief that domestic markets have bottomed out and a lot of headwinds have been factored in. The BSE Sensex surged by 370.15 points or 2.07% to 18240.68 during the week ended June 24, 2011. The S&P CNX Nifty heaved by 104.85 points or 1.95% to 5471.25.

Food inflation numbers have ricocheted a week after showing some signs of moderation. According to the data released by Ministry of Commerce and Industry, the index for Food Articles group rose to 9.13 percent for the week-ended June 11, from 8.96 percent for the previous week. The Consumer Price Index (CPI) stood at 107 points in May 2011, higher by 7% as compared to the base of 100 in 2010 and marginally up by 0.1% from the month of April. Foreign Institutional Investors (FIIs) were net sellers in the equity segment in the week with gross purchases of Rs 10400.60 crore and gross sales of 11526.70 crore, leading to a net outflow of Rs 1126.10 crore.


Weekly Market Outlook 18th June 2011

 SNAPSHOT

Indian equity indices extended the downtrend for the second consecutive week as investors at large continued to avoid long positions amid an increasingly vulnerable global as well as domestic setup. The hefty position squaring in last three session of the week proved very costly for the benchmark indices as it plunged over two percent on week on week basis. Foreign institutional investors (FII) restlessly attempted to plough back their hot money from the domestic markets because of confluence of worrying economic trends like accelerating inflation, declining foreign investment and slower growth and domestic investment, that policy inertia is only making worse. The BSE Sensex lost 398.01 points or 2.18% to 17870.53 during the week ended June 17, 2011. The BSE Mid-cap index plunged by 83.49 points or 1.21% to 6814.79 and the Small-cap index declined by 113.97 points or 1.38% to 8174.49.The S&P CNX Nifty slipped by 119.40 points or 2.18% to 5366.40. On the NSE, Bank Nifty lost 116.00 points or 1.08% to 10598.25, CNX IT sank 296.35 points or 4.45% to 6357.10 while CNX mid-cap declined 70.90 points or
0.89% to 7921.15 and CNX Nifty Junior dropped 227.20 points or 2.01% to 11051.25.

The annual rate of inflation, based on monthly WPI, came much higher than the expectation at 9.06% (Provisional) for the month of May, 2011 (over May, 2010) as compared to 8.66% (Provisional) for the previous month and 10.48% during the corresponding month of the previous year. RBI furthered its aggressive stance against the rampant inflation and hiked repo rate and reverse repo rate by 25 basis points each to 7.50% and 6.50% respectively, in its mid-quarter policy review, which was in line with broader market expectations. 


Read More: Equity Research Weekly Report


Weekly Market Outlook 4th June 2011


SNAPSHOT

Despite concluding three out of the five trading session of the week in the negative zone, Indian benchmarks still negotiated a close in the green territory with gains of well over half a percent on the week on week basis. In their journey, the key indices also went on to break the two week downtrend but failed to hold on to the psychological 5,600 and 18,650 levels. Investors went through a hectic week as an assortment of reports popped through the period keeping investors in a dilemma and frontline indices in a sticky situation. Bullishness seemed to be returning to the markets which were evident from the fact that the frontline indices showed some resilience and did not capitulate despite an assortment of disappointing economic reports. To start with it was the GDP data released on Tuesday which showed that nation's economy grew by 7.8% in the fourth quarter ending March this year, mainly due to poor performance of the manufacturing sector. On Wednesday, the HSBC PMI figures based on a survey of around 500 companies were released which showed manufacturing activity in India in May slowed from a month earlier, yet output remained robust, reflecting the underlying strength in business conditions.

Furthermore an official data released by the Ministry of Commerce showed that India's six core industries grew by 5.2% in April 2011 as compared to 7.4% in the previous month and 7.5% in the same month of last year. Another data released by the commerce ministry showed that India's trade deficit in April narrowed to $8.98 billion from $11.03 billion in the same period a year earlier, however, the trade deficit rose (month on month) to $8.98 billion in April from $5.6 billion in March.

Read More: Equity Research Weekly Report

Nifty Apr Fut closed at a premium of 25.55 points ! Derivative Report By Mansukh 29th-april-2011

Derivative Research Report
F & O HIGHLIGHTS
Nifty April 2011 futures closed at 5,785.20, at a discount of 0.25 points over spot closing of 5,785.45, while Nifty May 2011 futures were at 5,811.00 at a premium of 25.55 points over spot closing. The near month April 2011 derivatives contract expires today. Nifty April futures saw contradiction of 3.93% or 0.52 million (mn) units, taking the total outstanding open interest (OI) to 12.83 mn units.
From the most active underlying, ICICI Bank April 2011 futures closed at a premium of 5.25 points at 1117.40 compared with spot closing of 1112.15. The number of contracts traded was 41,387.
ICICI Bank May 2011 futures were at a premium of 8.45 point at 1120.60 compared with spot closing of 1112.15. The number of contracts traded was 39,310.
SBI's April 2011 futures were at a premium of 7.00 points at 2855.35 compared with spot closing of 2848.35. The number of contracts traded was 20,979.
Infosys April 2011 futures were at a premium of 6.50 points at 2928.75 compared with spot closing of 2922.25. The number of contracts traded was 19,210.
SBI's May 2011 futures were at a premium of 24.00 points at 2872.35 compared with spot closing of 2848.35. The number of contracts traded was 18,164.
Open Interest Gainer & Looser

Nifty Option Open Inetrest
Nifty Option Open Interest Distribution
Nifty May 5800 call added 7.09 lakh shares in OI, up 51.11% and 5900 call added 6.62 lakh shares in OI, up 37.49%. On the put side nifty May 5700 put added 5.15 lakh shares in OI, up 7.18% and 5600 put added 6.85 lakh in OI, up 21.54%. The put-call ratio of stock option increased from 0.37 to 0.42 while put-call ratio of index option decreased from 0.83 to 0.79. On the whole the put call ratio was at 0.78.

Related post about Derivative Strategy

To more about Future Level Report
Margin Report By Mansukkh

Equity Result Updates - Experts Prediction On Market Trends 23rd-April-2011

Below Estimates with Muted Guidelines for FY12
Data Matrix as on 21.04.11 (BSE)
Infosys Technologies,India's second largest IT services exporter once again disappointed the market with the Q4FY11 results below estimates. Although, company has reported quite well but not line with the expectations. Actually, for FY11-12 the guidance of revenue in dollar terms at 18-20% and the EPS of 8-10% are quite acceptable but in rupee terms EPS guidance of Rs 126.05-128.21 is quite disappointed the street. The revenue of the company from banking and financial segment also consolidated in the same quarter.

For FY11, the consolidated revenues of the company stood at Rs 27,501 crore, up 20.93% compared to Rs 22,742 crore reported in the last year. Net profit of the company increased by 9.71% to Rs 6,823 crore against Rs 6,219 crore for the year ended March 31, 2010. Segmental revenue showed a good improvement from Financial Services, up by 27.56% to Rs 9,862 crore from Rs 7,731 crore, Manufacturing revenue were up by 19.68% to Rs 5,393 crore from Rs 4,506 crore and the Retail revenue grew by 28.43% to Rs 3,898 from Rs 3,035 crore, however revenue from Telecom segment declined by 3.06% to Rs 3,549 crore from Rs 3,661 crore in last year. Earnings per share for financial year 2010-11 improved to Rs 119.41 from Rs 108.90.

PERFORMANCE ANALYSIS YEARLY

Both margins down by more than 165bps…
For the year ended FY11 Infosys has reported jump of more than 20% in its Net Sales to Rs 25385 crore from Rs 21140 crore in FY10. On account of increase in Cost of Services & Raw Materials up to 50% the operating profit of the company increase by 14.3% to Rs 8414 crore from 7360 crore in previous year and with the jump of 12% from FY10 the Profit After Tax for the same period stood at Rs 6443 crore. Operating Margin of the Infosys for FY11 declined by 167bps to 33.15% while PAT Margin turned down by 184bps to 25.38% during the same period.

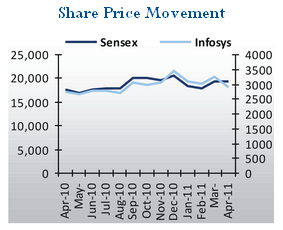
Share Price Movement

Segment - Consolidation in Telecom Segment…
For FY11 on segmental basis the major contributor of revenue Financial Services reported rise of 26.37% to Rs 9293 crore compared to Rs 7354 crore this segment has contributed around 36.6% for the same period, Manufacturing Services add 17.5% revenue with the jump of 18.5% to Rs 4686 crore from Rs 3988 crore, Retail segment which accounts around 15% revenue surged by 25.69% to Rs 3757 crore from Rs 2989 crore while due to stiff competition in the sector the Telecom segment revenue came at Rs 3134 crore, down by 3.09% from Rs 3234 crore this has contributed around 12.35% to the total revenue in FY11. The other segments which also accounts 17.8% of the Infosys total revenue has also shown growth of 26.3% to Rs 4515 crore from Rs 3575 crore in FY10.


Read more about Equity Result Updates

Derivative Strategy On Future And Option Report By Mansukh 26-April-2011

Derivative Strategy
F & O HIGHLIGHTS
Nifty April 2011 futures closed at 5,877.00, at a premium of 2.50 over spot closing of 5,874.50, while Nifty May 2011 futures were at 5,902.00 at a premium of 27.50 points over spot closing. The near month April 2011 derivatives contract expires on Thursday, April 28, 2011. Nifty April futures saw an addition of 6.01% or 1.36 million (mn) units, taking the total outstanding open interest (OI) to 24.17 mn units.
From the most active underlying, SBI's April 2011 futures closed at a premium of 11.80 points at 2926.90 compared with spot closing of 2915.10. The number of contracts traded was 20,255.
Infosys April 2011 futures were at a premium of 3.40 point at 2943.40 compared with spot closing of 2940.00. The number of contracts traded was 19,950.
Sterlite Industries April 2011 futures were at a premium of 0.95 points at 184.80 compared with spot closing of 183.85. The number of contracts traded was 19,317.
Axis Bank April 2011 futures were at a premium of 4.40 points at 1382.00 compared with spot closing of 1377.60. The number of contracts traded was 20,321.
RIL April 2011 futures were at a premium of 3.00 points at 1012.00 compared with spot closing of 1009.00. The number of contracts traded was 27,240.

Read More about Derivative Strategy Report


Derivative Strategy On Future And Options Daily Report By Mansukh 11th-April-2011

derivative trading in india
F & O HIGHLIGHTS
Nifty April 2011 futures closed at 5,859.30, at a premium of 17.30 over spot closing of 5,842.00, while Nifty May 2011 futures were at 5,877.00 at a premium of 35.00 points over spot closing. The near month April 2011 derivatives contract expires on Thursday, April 28, 2011. Nifty April futures saw an addition of 3.50% or 0.93 million (mn) units, taking the total outstanding open interest (OI) to 27.67 mn units.

From the most active underlying, SBI's April 2011 futures closed at a premium of 2.20 points at 2783.00 compared with spot closing of 2780.80. The number of contracts traded was 19,602. ICICI Bank April 2011 futures were at a premium of 5.65 points at 1103.60 compared with spot closing of 1097.95. The number of contracts traded was 16,513.

Tata Motors April 2011 futures were at a discount of 6.55 points at 1245.50 compared with spot closing of 1252.05. The number of contracts traded was 12,095.

DLF April 2011 futures were at a premium of 0.65 points at 260.70 compared with spot closing of 260.05. The number of contracts traded was 14,173.

Tata Steel April 2011 futures were at a premium of  0.05 points at 629.40 compared with spot closing of 629.35. The number of contracts traded was 11,723.
online commodity trading

Read more about Derivative Strategy Report By Mansukh

Future Level Morning Report By Mansukh.

More info about Equity Research Market Report by Mansukh

Derivative Strategy On Future And Options Daily Report By Mansukh 7th-April-2011

Derivative Margin Report
F & O HIGHLIGHTS
Nifty April 2011 futures closed at 5,912.00, at a premium of 20.25 over spot closing of 5,891.75, while Nifty May 2011 futures were at 5,931.50 at a premium of 39.75 points over spot closing. The near month April 2011 derivatives contract expires on Thursday, April 28, 2011. Nifty April futures saw an addition of 3.90% or 1.05 million (mn) units, taking the total outstanding open interest (OI) to 27.95 mn units.

From the most active underlying, SBI's April 2011 futures closed at a premium of 6.60 points at 2793.00 compared with spot closing of 2786.40. The number of contracts traded was 25,131.

Tata Motors April 2011 futures were at a discount of 18.60 points at 1278.50 compared with spot closing of 1297.10. The number of contracts traded was 22,539.Titan April 2011 futures were at a premium of 27.00 points at 4053.00 compared with spot closing of 4026.00. The number of contracts traded was 10,167. 

DLF April 2011 futures were at a premium of 1.40 points at 271.60 compared with spot closing of 270.20. The number of contracts traded was 16,777. Tata Steel April 2011 futures were at a premium of 1.25 points at 635.75 compared with spot closing of 634.50. The number of contracts traded was 14,016. 

Open Interest Gainer & Open Interest Loser

Read more about Equity Research morning report.

To know more about Derivative Future Level morning report by Mansukh.

INDEX - TECHNICAL STAND POINT - Equity Research Report By Mansukh

Nifty | Bank Nifty


TREND LINE CONJECTURE:-

We have drawn trend line joining two significant bottom 3918 and 4786. According to trend line theory next levels of support could be around 5400. Any closing below this trend line may further dampens the current scenario and possibility of getting new lows near to 5200-5250 could be more justified. On the upper side any bounce back from 5400 may leap indices towards 5640-5650 where we might see some profit booking
Same in the Sensex , channel line drawn from the lows of 13219 and 15960 may provide crucial support around 17900-18000. Below this flood gates may open and we might see some drastic fall near to 16000 in a short span of time. On the flip side 20500 could be the key resistance level to watch.

MOVING AVERAGES AND THE CANDLE STICK PATTERN:-

The short term moving average is an indicator of the trend in the near future. The value for the short term moving average (20 DMA) is at 5470 and medium term moving average (50 DMA) is at 5740. Presently, the Nifty trading below20 , 50 and 2000 dma, which would be treated as bearish si signal coupled with oversold territory. Hence possibility of bounce back couldn’t be rule out at any stage though5640-5650 (200 dma) might be the key resistance zone.

FIBONACCI RETRACEMENT:-

Entire rally from the lows of 4786 to 6335 took 25 trading weeks without any substantial correction. If we applying Fibonacci theory and took retracement of this current rally, 50% and 80% retracement stood at 5555 and 5375 respectively. Any break down above this level could open the flood gates and possibility of losing another 100-200 pts should be on higher side. Moreover spot index created some gap on 14/02/211 of more than 30pts which has not been filled yet. Hence we are expecting this gap should be filled in the upcoming week however possibility of bounce back couldn’t be rule out at any stage.

Read more about INDEX - TECHNICAL STAND POINT